
Weight trajectory
Weight is falling
Over the last 59 days your weight is falling by 0.50 kg a week. Latest: 77.6 kg. At this pace you reach 74.0 kg between 22 November 2026 and 28 November 2026.
51 readings · R² 0.96
Choose dinners that fit your busy days, keep track of shopping, and use each weekly review to make the following week easier.
Progress from recorded trackers, not a health rating. Missing data is not counted.
17 foods on 30 days
AI can be wrong. For chest pain, medication questions or symptoms that keep getting worse, see a doctor.
The small number is the change against the 30 days before. With ▲▼ it is bigger than your normal day-to-day swing (a statistical test); without, it may be chance. Tap a tile for the detail.
Over the last 59 days your weight is falling by 0.50 kg a week. Latest: 77.6 kg. At this pace you reach 74.0 kg between 22 November 2026 and 28 November 2026.
On your 21 days with 42 min+ of workouts, deep sleep that night averaged 1 h 40 min; on the other 23 it was 1 h 25 min — a difference of +15 min (+18%).
On your 22 days with 7 h 26 min+ of sleep, mood averaged 4.0/5; on the other 23 it was 3.2/5 — a difference of +0.8 points.
Lined up around your 21 fasts of 16 h or more, weight the next morning averages 79.0 kg against your usual 80.5 kg. They happen too often to tell how long the effect lasts — the chart shows every event, overlaps included.
On the upper half of your days (9,237+ steps), you slept 35 min more that night and got 19 min more deep sleep. Deep sleep made up 22% of those nights against 19%. Deep sleep changes most sharply around 9,500 steps. Your sleep does not level off — it keeps rising across your whole range.
Lined up around your 9 workouts of 1 h 5 min or more, sleep that night averages 7 h 50 min against your usual 7 h 22 min. They happen too often to tell how long the effect lasts — the chart shows every event, overlaps included.
Patterns in your own logs, not medical advice — and a pattern is not a cause. Every “signal” chip is earned from a test run across all the questions at once, so a quiet week honestly shows fewer cards. Personal experiments are the one place a cause can be tested.

Today · Tue 6 Oct
typical = your last 28 days with an hourly record
Steps → Mood Strong signal
Moving more goes with feeling better
On your 22 days with 9,127+ steps, mood averaged 3.8/5; on the other 23 it was 3.4/5 — a difference of +0.4 points.
ρ +0.44 · 45 paired days · p 0.003
The same tests as Insights: your own paired days, corrected for testing many things at once.
Advice built from your own steps and workouts.

Last night · Mon 5 → Tue 6 Oct
Arrows: this week's average against your 30-day average.
Tags feed the patterns above.
Advice built from your own nights.


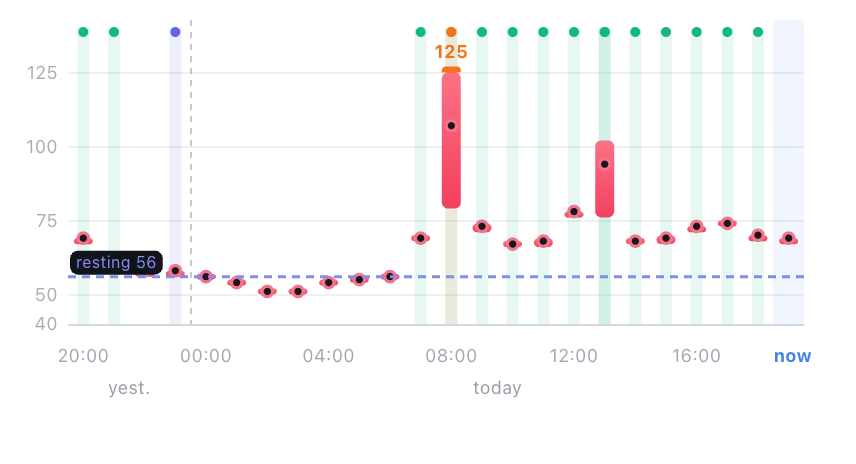
Latest reading · 19:00 · Health Connect
Your pulse each minute, with the moments you lay down, sat up or stood up
Single readings — minute data for this day has not been brought in.
Average pulse by day and hour · 5 weeks
Weekends and weekdays look alike
Your 90-day range 54–60 · Usual 56
How your pulse changes when you stand up, compared with your own earlier tests
Lie still for a few minutes, then stand up and stay standing while TempoLife collects your pulse. Takes 8–15 minutes.
For fitness and recovery tracking. Not a medical test.
Max 187 bpm · from your profile
Time in zone, your last 7 workouts
Advice built from your own readings.


Not fasting
Glycogen depleting, insulin dropping
Ask anything, or read the science and refeed guides.


Today
Solid day
Patterns in your own check-ins — they go together, which is not the same as one causing the other.
The app's own read of your last two weeks.

Weighed today
A ready tip from the library, or an AI read of your trend.

BMI = weight / height². A guide only — it ignores muscle mass.
The figure beside each one is what it loads
—
—
—
—
—
—


